Air conditioner usage is now a mainstream household behavior in the United States and a fast-rising electricity driver globally. In the U.S., AC use is already near-universal in many regions, while globally, cooling demand is rising quickly as temperatures, incomes, and appliance access increase.
air conditioner usage statistics
Top air conditioner usage statistics
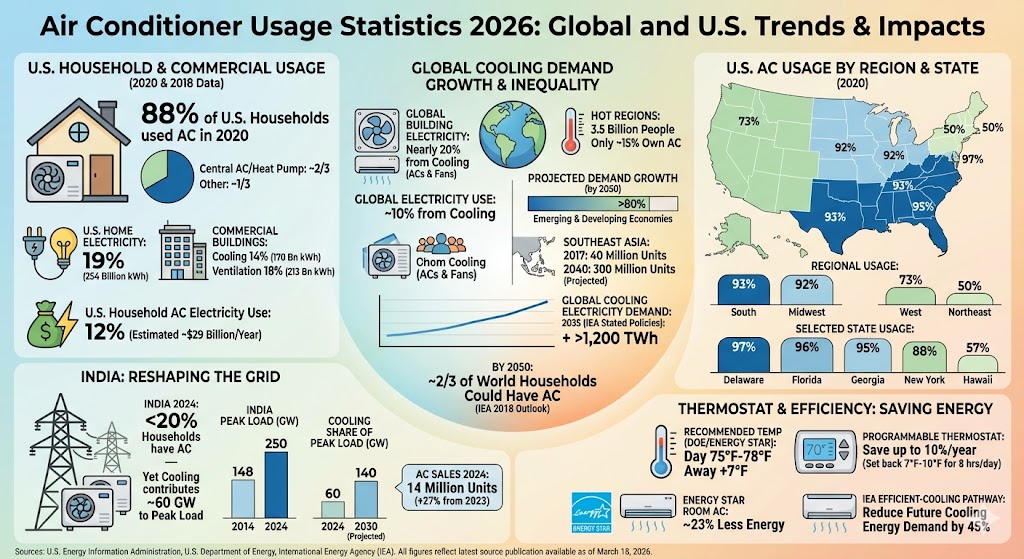
88% of U.S. households used air conditioning in 2020.
About two-thirds of U.S. households used central AC or a central heat pump as their main AC equipment.
Air conditioning accounted for about 19% of electricity consumption in U.S. homes in 2020, equal to 254 billion kWh.
Cooling accounted for about 14% of total electricity consumption in U.S. commercial buildings in 2018, equal to 170 billion kWh.
Ventilation used another 18% of commercial-building electricity in 2018, or 213 billion kWh.
Air conditioners use about 12% of the electricity in U.S. households and add up to about $29 billion a year in homeowner costs.
In the South, 93% of households used AC in 2020, versus 92% in the Midwest, 73% in the West, and 50% in the Northeast.
Florida had a 96% household AC usage rate in 2020, while Hawaii was at 57%.
Cooling with air conditioners and electric fans accounts for nearly 20% of electricity used in buildings worldwide, or about 10% of global electricity use.
About 3.5 billion people live in hot regions, but only about 15% own an air conditioner.
More than 80% of projected electricity demand growth for cooling by 2050 is expected to come from emerging and developing economies.
Global electricity demand for cooling is projected to rise by more than 1,200 TWh by 2035 under the IEA’s Stated Policies Scenario.
In India, fewer than 20% of households had AC in 2024, yet cooling still contributed an estimated 60 GW to peak load.
India sold 14 million AC units in 2024, up 27% from 2023.
By 2050, around two-thirds of the world’s households could have an air conditioner.
U.S. household air conditioner usage by region
The U.S. has one of the highest household AC usage rates in the world, but adoption still varies a lot by region. Usage is highest in the South and Midwest and materially lower in the West and Northeast.
Label
Bar
Value
South
93%
Midwest
92%
West
73%
Northeast
50%
Max = 93%. Widths: South 100.00%, Midwest 98.92%, West 78.49%, Northeast 53.76%.
Selected U.S. state air conditioner usage rates
State-level usage is even more uneven. In 2020, AC usage was nearly universal in states such as Delaware and Florida, while Hawaii was much lower.
Label
Bar
Value
Delaware
97%
Florida
96%
Georgia
95%
New York
88%
Hawaii
57%
Max = 97%. Widths: Delaware 100.00%, Florida 98.97%, Georgia 97.94%, New York 90.72%, Hawaii 58.76%.
Global air conditioner usage and demand growth
Worldwide, cooling is no longer a niche energy use. The IEA says cooling from air conditioners and fans already uses nearly one-fifth of all electricity consumed in buildings. At the same time, access is still highly unequal: billions of people live in hot climates, but only a small minority own AC.
Cooling from ACs and fans accounts for nearly 20% of electricity used in buildings worldwide.
That equals about 10% of total global electricity consumption.
About 3.5 billion people live in high-temperature regions, but only about 15% own an air conditioner.
More than 80% of projected cooling-related electricity demand growth by 2050 is expected in emerging and developing economies.
Southeast Asia had AC in only 15% of households, but the region’s stock of units is projected to rise from 40 million in 2017 to 300 million in 2040.
Under current policy settings, global electricity demand for cooling is projected to rise by more than 1,200 TWh by 2035.
The IEA’s 2018 cooling outlook projected that around two-thirds of the world’s households could have an air conditioner by 2050.
India shows how AC usage can reshape the grid
India is a useful usage benchmark because AC ownership is still below advanced-economy levels, yet cooling already has a major effect on electricity peaks. That makes it one of the clearest examples of how air conditioner usage can drive grid expansion.
Label
Bar
Value
India peak load (2014)
148 GW
India peak load (2024)
250 GW
Cooling share of peak load (2024)
60 GW
Projected cooling share of peak load (2030)
140 GW
Max = 250 GW. Widths: India peak load (2014) 59.20%, India peak load (2024) 100.00%, Cooling share of peak load (2024) 24.00%, Projected cooling share of peak load (2030) 56.00%.
Thermostat and efficiency statistics
Usage statistics are only part of the story. Efficiency settings and equipment choice can materially change how much electricity air conditioner usage turns into.
DOE and ENERGY STAR recommend starting with an indoor temperature of 75°F to 78°F during the day.
DOE and ENERGY STAR also recommend increasing the setpoint by 7°F when nobody is home.
A programmable thermostat can save as much as 10% a year on heating and cooling if it is set back 7°F to 10°F for 8 hours a day.
ENERGY STAR certified room air conditioners use approximately 23% less energy, depending on product class.
The IEA says an efficient-cooling pathway could reduce future cooling energy demand by 45% versus its reference case.
Sources
U.S. Energy Information Administration, Nearly 90% of U.S. households used air conditioning in 2020.
U.S. Energy Information Administration, How much electricity is used for air conditioning in the United States?
U.S. Department of Energy, Energy Saver: Air Conditioning.
U.S. Department of Energy, Energy Saver: Home Cooling Systems.
U.S. Department of Energy, Energy Saver: Programmable Thermostats.
International Energy Agency, The Future of Cooling.
International Energy Agency, Staying cool without overheating the energy system.
International Energy Agency, World Energy Outlook 2024.
International Energy Agency, Electricity 2025.
International Energy Agency, Electricity 2026.
International Energy Agency, The Future of Cooling in Southeast Asia.
All figures reflect the latest source publication available as of March 18, 2026.